|
|
BUYERS' EXPECTATIONS: One of the five demand determinants assumed constant when a demand curve is constructed, and that shift the demand curve when they change. The other four are income, preferences, other prices, and number of buyers. If buyers expect the future price will be greater, then they're likely to buy more today, to avoid the higher future price. Alternatively, if buyers expect a lower future price, then they're likely to buy less today, awaiting the lower price. A higher future price induces an increase in demand and a lower future price induces a decrease in demand.
Visit the GLOSS*arama
|
|


|

|
                           MONOPOLY, DEMAND: The demand for the output produced by a monopoly is THE market demand for the good. In particular, if the market demand curve is negatively sloped (in accordance with the law of demand), then the demand curve for the output produced by a monopoly is also negatively sloped. The monopoly IS the market. The market demand IS the monopoly's demand. They are one and the same. Monopoly is a market in which a single firm is the only supplier of the good. Anyone seeking to buy the good must buy from the monopoly seller. This single-seller status gives monopoly extensive market control; it is a price maker. The market demand for the good sold by a monopoly is the demand facing the monopoly.Feet-First PharmaceuticalA hypothetical example that can be used to illustrate the demand for a monopoly is Feet-First Pharmaceutical. This firm owns the patent to Amblathan-Plus, the only cure for the deadly (but hypothetical) foot ailment known as amblathanitis. As the only producer of Amblathan-Plus, Feet-First Pharmaceutical is a monopoly with extensive market control. As such the market demand for Amblathan-Plus is also THE demand for Amblathan-Plus sold by Feet-First Pharmaceutical.Demand and RevenueDemand Curve,
Monopoly |  |
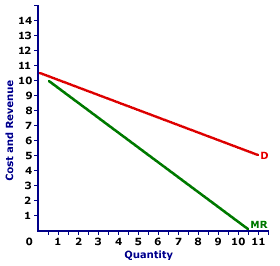
Single-seller status for Feet-First Pharmaceutical means that it faces a negatively-sloped demand curve, such as the one displayed in the exhibit to the right. The demand curve facing any monopoly is the market demand curve for the product.The top curve in the exhibit is the demand curve (D) for Amblathan-Plus. This demand curve is also the average revenue curve for Amblathan-Plus. It shows the per unit revenue received by Feet-First Pharmaceutical for the sale of Amblathan-Plus. For reference purposes, the lower curve is the marginal revenue curve (MR). This curve displays the extra revenue received by Feet-First Pharmaceutical for each extra ounce of Amblathan-Plus sold. Because a monopoly is a price maker with extensive market control, it faces a negatively-sloped demand curve. To sell a larger quantity of output, it must lower the price. For example, the Feet-First Pharmaceutical can sell 1 ounce of Amblathan-Plus for $10. However, if it wants to sell 2 ounces, then it must lower the price to $9.50. If it seeks to sell 3 ounces, then the price must be lowered to $9. Larger quantities are only sold it the price is less. For this reason, the marginal revenue generated from selling extra output is less than price. While the price of the second ounce sold of Amblathan-Plus is $9.50, the marginal revenue generated by selling the second ounce is only $9. While the $9.50 price means the monopoly gains $9.50 from selling the second ounce, it loses $0.50 due to the lower price on the first ounce ($10 to $9.50). The net gain in revenue, that is marginal revenue, is thus only $9 (= $9.50 - $0.50). By similar reasoning, the marginal revenue generated by the third ounce of Amblathan-Plus is only $8, even though the price is $9. On the plus side, Feet-First Pharmaceutical receives $9 from selling the third ounce. However, to sell the third ounce, it must lower the price on the first two ounces from $9.50 to $9. It loses $0.50 on each of these two ounces, or a total loss of $1. As such, the net gain in revenue, marginal revenue, is only $8 (= $9 - $1). Compared to Perfect CompetitionDemand,
Monopoly versus
Perfect Competition | 
|
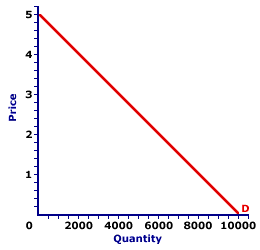
The demand facing monopoly can be compared with the demand facing a perfectly competitive firm. The demand curve for the output produced by a perfectly competitive firm is perfectly elastic, it is horizontal at the going market price. This is what makes a perfectly competitive firm a price taker. It must "take" whatever price is set in the overall market. Facing a downward-sloping demand curve, however, makes a monopoly a price maker. It has a great deal of control over the market and the market price. It IS the market!Consider the market demand curve for the hypothetical Amblathan-Plus pharmaceutical foot treatment. This market demand curve indicates that if the market price is $4 per ounce, then Amblathan-Plus buyers are willing and able to purchase 2,000 ounces of medicine. If the price is $1 per ounce, then they are willing and able to purchase 8,000 ounces. The first task is to compare this market demand curve for the demand curve facing Feet-First Pharmaceutical. To make this comparison, click the [Monopoly] button. Notice that NOTHING HAPPENS. It is the same curve. But of course! The market is the monopoly, the monopoly is the market. The next task is a comparison with perfect competition. Suppose the market for Amblathan-Plus is transformed into a perfectly competitive market, with thousands of different firms selling Amblathan-Plus. How does the demand curve facing one of the perfectly competitive firms selling this medicine compare to the monopoly demand? Click the [Perfect Competition] button to illustrate. The resulting curve is horizontal, or perfectly elastic. Also note that the horizontal quantity scale measurement changes from thousands of ounces to mere ounces. Each of the perfectly competitive firms is now a price taker, and the price they take is $2.50 per ounce.

Recommended Citation:MONOPOLY, DEMAND, AmosWEB Encyclonomic WEB*pedia, http://www.AmosWEB.com, AmosWEB LLC, 2000-2024. [Accessed: May 5, 2024].
Check Out These Related Terms... | | | | | |
Or For A Little Background... | | | | | | |
And For Further Study... | | | | | | | | | | | |
Search Again?
Back to the WEB*pedia
|


|

|
|
The 22.6% decline in stock prices on October 19, 1987 was larger than the infamous 12.8% decline on October 29, 1929.
|

|
|
"Each of us is issued but one life, and we know full well how it all ends. It would be regrettable to squander this one chance on someone else's appearance, someone else's experience. " -- Joseph Brodsky, Writer
|

|
PVCF
Present Value Cash Flow
|

|
|
Tell us what you think about AmosWEB. Like what you see? Have suggestions for improvements? Let us know. Click the User Feedback link.
User Feedback
|


|


